AAPL - Apple
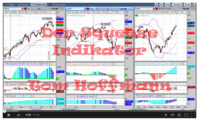
Since the December 2013, Apple (AAPL) has formed a triangle pattern, squeezing the price now at the tip of the triangle in a narrow range between 526 to 535. Because of the symmetry of this triangle, the patter is neither bearish nor bullish. At the same time, the TTM-Squeeze indicator with four red dots the weekly and daily charts indicates that a dynamic move is just ahead of us. If triggered this move will likely push the price for 8-10 weeks in one or the other direction (i.e. about 8-10 momentum bars of the weekly TTM-Squeeze). At this time, we don't know in which direction the journey will go, but we might use the squeeze of the 30-minute chart as a trigger.
My personal scheme to enter the trade with a 30-min trigger follows the rules:
1) The 8 EMA (green line ) needs to cross over the 20 SME (red mid-line of the Keltner Channel) in the 30-min chart
2) The 30-min candle needs to close above the swing high 533.75 (long) or below the swing low 526.33 (short)
3) The TTM_Squeeze needs to have fired after the close of the 30-min bar (one green dot after a series of red dots) with either a blue momentum bar up (long) or a red momentum bar down (short)


No comments:
Post a Comment