A free collection of entry and exit signals to help the trader decide when to be long or short, or ride the sideway waves
Showing posts with label AAPL. Show all posts
Showing posts with label AAPL. Show all posts
Tuesday, August 7, 2018
Wednesday, April 1, 2015
Wednesday, February 25, 2015
Monday, March 24, 2014
2014/03/23 AAPL Apple squeezed in weekly and daily charts setting up for a dynamic break-out
AAPL - Apple
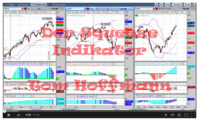
Since the December 2013, Apple (AAPL) has formed a triangle pattern, squeezing the price now at the tip of the triangle in a narrow range between 526 to 535. Because of the symmetry of this triangle, the patter is neither bearish nor bullish. At the same time, the TTM-Squeeze indicator with four red dots the weekly and daily charts indicates that a dynamic move is just ahead of us. If triggered this move will likely push the price for 8-10 weeks in one or the other direction (i.e. about 8-10 momentum bars of the weekly TTM-Squeeze). At this time, we don't know in which direction the journey will go, but we might use the squeeze of the 30-minute chart as a trigger.
My personal scheme to enter the trade with a 30-min trigger follows the rules:
1) The 8 EMA (green line ) needs to cross over the 20 SME (red mid-line of the Keltner Channel) in the 30-min chart
2) The 30-min candle needs to close above the swing high 533.75 (long) or below the swing low 526.33 (short)
3) The TTM_Squeeze needs to have fired after the close of the 30-min bar (one green dot after a series of red dots) with either a blue momentum bar up (long) or a red momentum bar down (short)
Subscribe to:
Posts (Atom)


