S&P 500

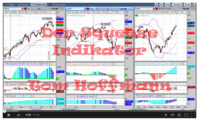
Just as forecasted in the blog below of January 21, a larger move occurred in the S&P 500 (and most other indexes) after the tipple-squeeze had built up "over pressure" that need to be released. In the earlier blog it was also mentioned that the 30-min squeeze could be used as a trigger in order to decide, in which direction the S&P 500 would fire (long or short). This trigger decision has worked out beautifully in this case and is therefore displayed here as a generic example.
In the figure above the cursor resides on the Jan 23 candle in the daily chart. The program automatically highlights the time period of Jan 23 in the 4-h and 30-min charts. While the squeezes of all three charts fired short on Jan 23, the 30-min squeeze was the first one to do so. In order to catch the big move, one would use the firing 30-min squeeze as the trigger, and then carefully observe if the other squeezes follow suit in the same direction. The stop loss would be placed fairly tightly in the 30-min chart, preferably above a Fibonacci Cluster or some other resistance level.
Once triggered, the release of the over pressure typically takes place during 6-8 bars before the squeeze momentum dies down. This also applies to the S&P 500 daily chart, which today is only three days (=bars) into the momentum release triggered on Jan 23. So I expect more movement downwards ...


