A free collection of entry and exit signals to help the trader decide when to be long or short, or ride the sideway waves
Showing posts with label DIA. Show all posts
Tuesday, January 14, 2014
2014/01/14 ES (SPY, SPX) at strong Fibonacci Cluster Support - will it hold?
After yesterday's significant sell-off, the E-mini S&P 500 Futures formed a large red candle that has reached an important Fibonacci support cluster. Today's price action will show if this support level can hold. If so, the rally might continue with upside targets in the 1852 - 1857 range.
Labels:
daily chart,
DIA,
DOW,
ES,
Fibonacci Clusters,
midterm,
resistance,
S&P 500,
SPX,
SPY,
support
Thursday, November 7, 2013
2013/11/07 DAX Double-Whammy Squeeze: 4h and 1h power waiting for today's news releases
The DAX and many other indices are setting up for a double-whammy: pressure is building before the news releases today, and the indices are squeezed into narrow ranges. The DAX has a Squeeze in the 1h and the 4h chart, just waiting to release the pressure in one or the other direction. Two-sided strategies that speculate on larger movements are favored in this situation.
Wednesday, November 14, 2012
2012/11/13 blog.kimblechartingsolutions.com: Dual test of support for the S&P 500 (SPX, SPY)
In his blog, Chris Kimble identifies a current long-term rising wedge pattern in the S&P 500, which resembles the rising wedges that build up during the periods 1998-2000 and 2006-2007, before large market shifts to the downside occurred. The current wedge is also nearing long-term resistance at 1550 that has held since 2000. In conclusion, this is a time when "risk off" is definitively the safer play!
Chris Kimble blogs: "An important "Dual Test of support" is at hand right now for the 500 index. Long investors best hope it holds, because the support line off the 2009 low is very important! FYI- Support is Support until broken! Twice over the past 12 years, the 500 index broke support lines of these rising wedges at (1) in the chart below and prices fell off quiet a bit."
Friday, June 22, 2012
2012/06/21 DOW JONES midterm Elliott Wave VIDEO ANALYSIS and CHART
After yesterday's sell-off, it's time for a fresh Elliott look at the DOW JONES INDUSTRIAL INDEX. As we have run against the mayor resistance level at 12900 in the last days, yesterday's huge drop can be interpreted as the start of a new mid-term Elliott wave. This wave will be the 3rd leg of an ABC formation that started with a dynamic Wave A down during May 2012 and its subsequently corrected in Wave B up until June 20. The recently launched 3rd Elliott Wave C is expected to cover at least 100% of the range of Wave A, i.e. the target area for Wave C will be around 11600. At the current stage (DOW @12600, with our target about 1000 ticks away), this setup provides us with good opportunities to construct mid-term trades with a few weeks holding time and very beneficial risk/reward ratios.
Mid-term: Wave C will likely develop in 5 sub-waves down to 12400, 12000 and finally 11600.
Video Analysis for the Dow Jones Industrial Index
Friday, June 8, 2012
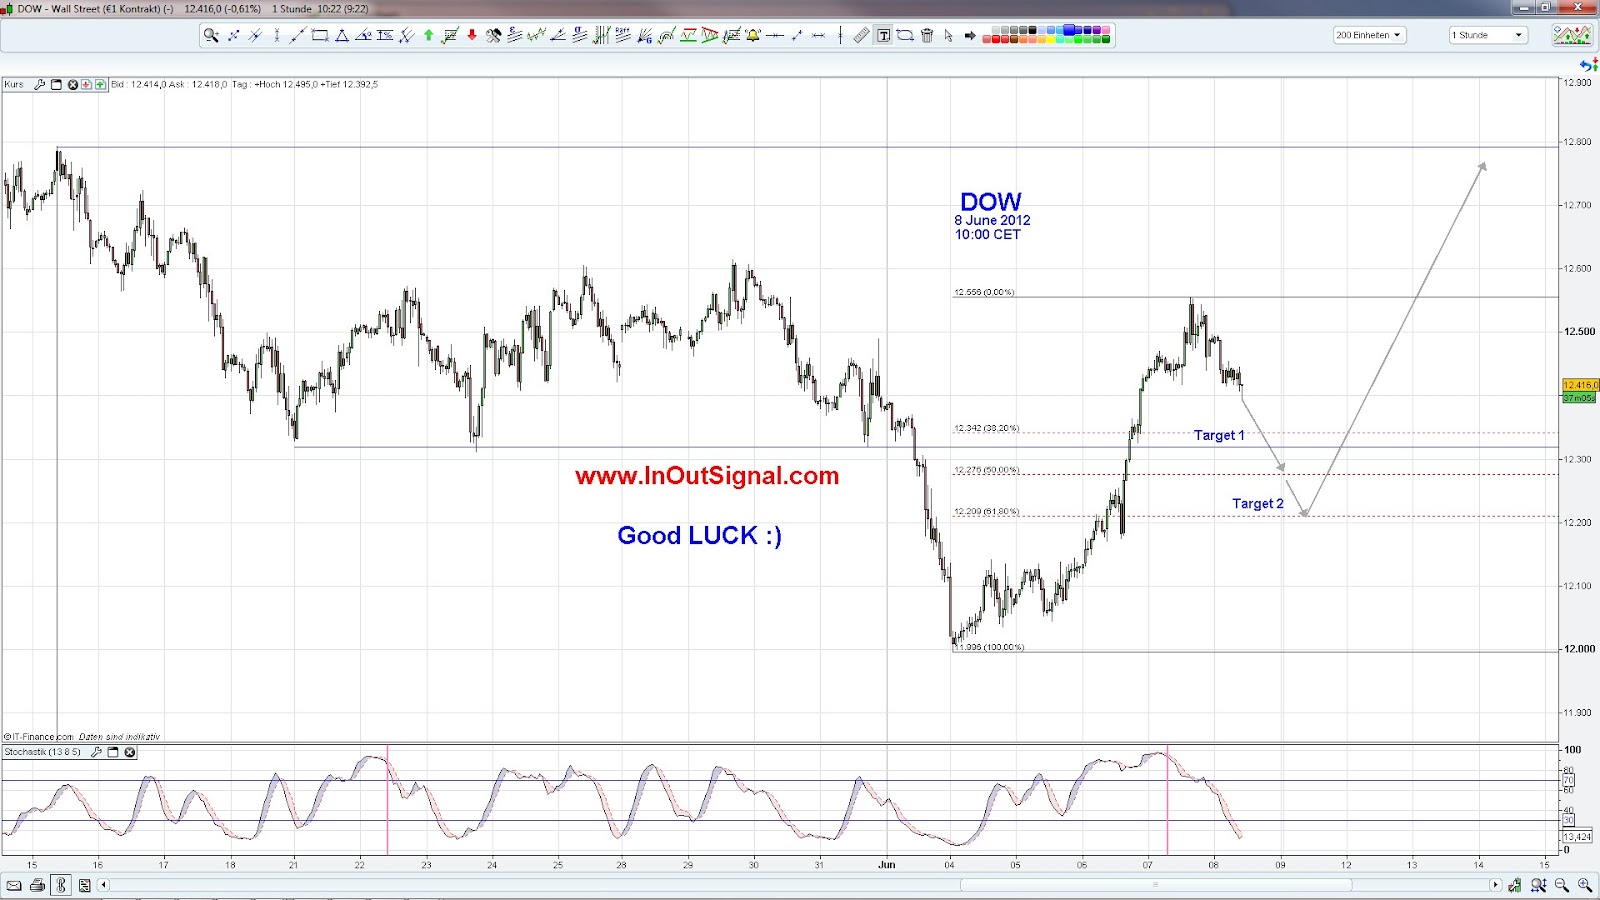
2012/06/08 11:00 CET: DOW daytrade idea based on Elliott Waves and Fibonacci
Chances are good that today we will see a
bearish retracement of the DOW into the 50-61% area (12300 - 12200) or or even
lower. The upwards trend since June 4 has already been broken this morning, at around 10:00 CET. For Elliott Wave and Fibonacci fans there is also a video for more details on the analysis.
Subscribe to:
Posts (Atom)