Showing posts with label Elliott wave. Show all posts

Thursday, October 17, 2013

2013/10/17 EEM Emerging Markets ETF - daily chart with Fibonacci Cluster targets and Elliott wave count


EEM MSCI Emerging Markets ETF - daily chart with Fibonacci Cluster targets and Elliott wave count:
Target Zone 1 (around 127.2% extension):             43.6-44
Target Zone 2 (around 161.8% extension):             44.6-45

Monday, November 19, 2012

2012/11/91 EURAUD Elliott Wave VIDEO ANALYSIS and CHART

Today on Nov 19, 2012, the EURAUD currency pair exhibits nice emerging ABC patterns in three different time frames, the 5 min, 4 hour and daily charts. The chart and the purely educational video below show how an entry into the marked would be possible in the lowest time frame (5 min) with a relatively low-risk nearby stop, but with a potential to catch a long run that might lead up to 1.3 or higher in the daily time frame.


Video Analysis: EURAUD


Be aware that trading any kind of financial asset carries the risk of loosing money!
Friday, June 22, 2012

2012/06/21 DOW JONES midterm Elliott Wave VIDEO ANALYSIS and CHART


After yesterday's sell-off, it's time for a fresh Elliott look at the DOW JONES INDUSTRIAL INDEX. As we have run against the mayor resistance level at 12900 in the last days, yesterday's huge drop can be interpreted as the start of a new mid-term Elliott wave. This wave will be the 3rd leg of an ABC formation that started with a dynamic Wave A down during May 2012 and its subsequently corrected in Wave B up until June 20. The recently launched 3rd Elliott Wave C is expected to cover at least 100% of the range of Wave A, i.e. the target area for Wave C will be around 11600. At the current stage (DOW @12600, with our target about 1000 ticks away), this setup provides us with good opportunities to construct mid-term trades with a few weeks holding time and very beneficial risk/reward ratios.


Mid-term:  Wave C will likely develop in 5 sub-waves down to 12400, 12000 and finally 11600.


Video Analysis for the Dow Jones Industrial Index

Thursday, June 14, 2012

2012/06/14 EURUSD midterm Elliott Wave chart

Updated mid-term chart for our earlier EURUSD VIDEO ANALYSIS of 1 June 2012


Mid-term:  corrective Wave 4 has reached the 38.2% retracement level and is likely to head down in Wave 5 to 1.2274 (100%) or 1.2032 (161.8%)
     

Friday, June 8, 2012

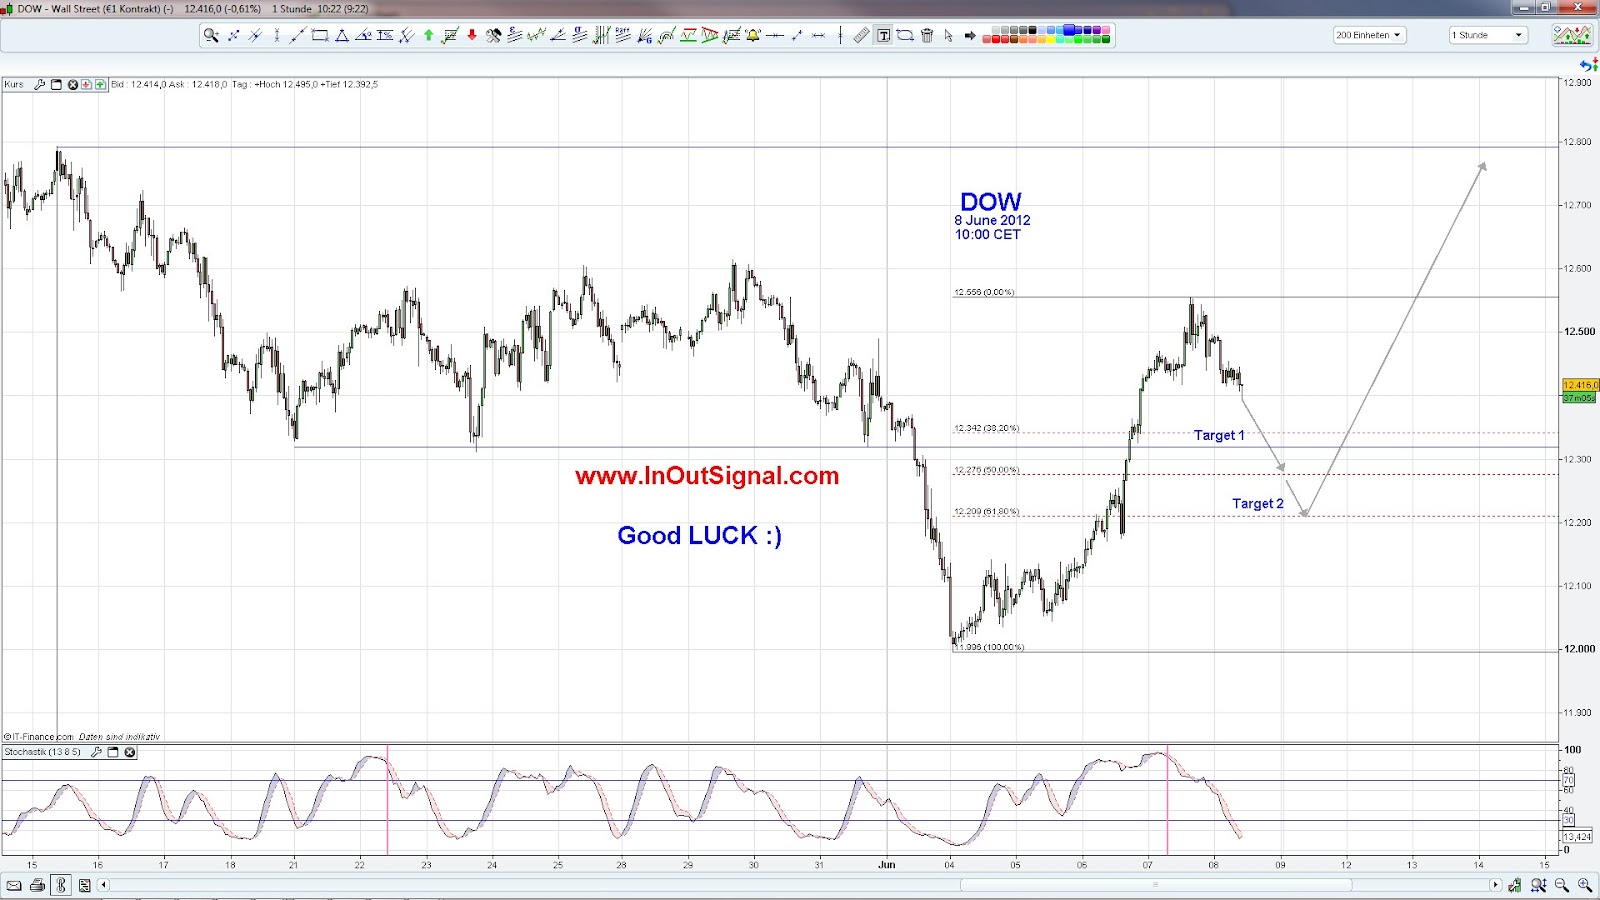
2012/06/08 11:00 CET: DOW daytrade idea based on Elliott Waves and Fibonacci

Chances are good that today we will see a bearish retracement of the DOW into the 50-61% area (12300 - 12200) or or even lower. The upwards trend since June 4 has already been broken this morning, at around 10:00 CET. For Elliott Wave and Fibonacci fans there is also a video for more details on the analysis.


Monday, June 4, 2012

2012/06/04 mid-term Elliott Analysis of the German DAX

Mid-term:   after the break of the purple Elliott 5-Wave defense line on June 1, 2012 at 6200, the way is now open for further moves downwards, possibly following a new 5-Wave pattern. In this pattern, Wave 3 could initially run down to about 5770 (162.8% extension) and then retrace back to about 6200 in Wave 4 (38.2% retracement)  

Long-term:  if this 5-wave pattern develops, Wave 5 could reach down as far as 5600 or even approach the September 2011 low at around 5000 

Sunday, June 3, 2012

2012/06/03 Why InOutSignals for S&P500, DOW and DAX turned red on June 1, 2012


This video will give you a quick update on a few important market signals followed here on
InOutSignal.com and it will deliver one clear message:
Watch out, the risk is high at the moment that markets will drop sharply !


Tuesday, April 3, 2012

2012/04/03 InOutSignal midterm Elliott wave charts for the DAX and Silver ( SLV - XAGUSD )

Find updated midterm Elliott wave charts for the DAX and the Silver ( SLV - XAGUSD ) on InOutElliott


SLV - XAGUSD   
                                                 

Tuesday, March 6, 2012

2012/03/05 InOutSignal midterm Elliott wave charts for the DAX and the Russel 2000

Find updated midterm Elliott wave charts for the DAX and the Russel 2000 on InOutElliott


DAX                                                    Russel 2000


Friday, March 2, 2012

2012/03/02 NEW on InOutSignal: midterm and longterm Elliott wave analyses on selected indices and currencies

A new page has been added to InOutSignal.blogspot.com, in order to provide my users with midterm and longterm Elliott wave analyses on selected indices and currencies. Please check out this link:  InOutElliott