Showing posts with label Fibonacci. Show all posts

Friday, August 29, 2014

2014/08/29 UNG - Natural Gas Midterm Setup with Fibonacci Targets & Squeeze Support

UNG setup


Long Trade Setup for UNG (Natural Gas ETF) with Fibonacci Support/Resistance Clusters and midterm targets from the daily Chart:

- solid Fibonacci support cluster at 21
- seasonally expecting move up until the end of the year
- geo-political situation might help 
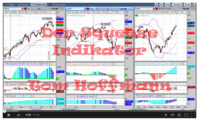
- the daily Squeeze just fired long yesterday, so we expect an average of 8-10 bars of daily push power
- breakout to a new swing high yesterday indicates that a new long trend could be established
Fibonacci-target 1: 23
Fibonacci-target 2 (and hurdle on the way up): 23.4-23.7

My Trade Strategy is to sell an at-the-money Put Credit Spread :  Sell GTC Jan15 +21/-23 ATM PCS at $1.10 or better (currently $1.13).
The idea is to have an "edge" from the analysis and to implement the trade with a neutral 1:1 risk/reward, after having paid commissions. If the spread is sold at $1.10, the max risk will be $0.90 + commissions.

If UNG expires in January above $23 you'll make +100% profit, if it expires below $21 your take the full loss of -100% (this works like a risk-balanced binary option, that's why I call it 100binOpts). In effect, you need only a $1 move up to make full profit on the trade. If you end up somewhere in between the $21-23 range you'll experience a partial profit or loss. Of course, partial profits/losses can also be taken at any time earlier than Jan 15.

Tuesday, August 26, 2014

2014/08/26 TSLA Squeeze Setup with Fibonacci Targets

TSLA setup


Long Trade Setup with Fibonacci Support/Resistance Clusters and midterm and longterm targets from the daily and weekly Charts:

- the weekly Squeeze has already fired long and a few more bars of push momentum in reserve
- the 4 hour Squeeze is getting ready fire long (with overnight data it already fired long)
- Fibonacci-support-cluster at 253-250
Fibonacci-targets on the daily chart: 271.4 and 276.9
Fibonacci-targets on the weekly chart: 288.9 and 319.3

Saturday, August 9, 2014

2014/08/09 FSLR Squeeze Setup with Fibonacci Clusters

FSLR setup


Long Trade Setup with Fibonacci Support/Resistance Clusters and Squeeze push engine:

- above all EMAs 21/50/200 (supercalifragilistic setup)
- great push up from EMA 200 after earnings on good volume
- daily squeeze triggered long (2 bars) - weekly squeeze in place
- Fibonacci-support-cluster 60-55
Fibonacci-target 80
Fibonacci-hurdle 70

The first move up has taken FSLR up to the Fib-hurdle around 70. A pullback in the 65 zone would be nice and for me a preferred entry zone. If FSLR manages to get through the 70 zone, the move has a high probability to get to 80.

My Trade Strategy is to sell an at-the-money 
Put Credit Spread (my GTC limit order being already in the market):  Sell Sep14 62.5/67.5 ATM PCS at $2.55 GTC (currently $2.03)

=> if the FSLR expires above $67.5 you make +100% profit, if it expires below $62.5 your take the full loss of -100% (works like a binary option); if you end up in between the $62.5 - $67.5 zone you experience partial profit/loss

Should FSLR pull back to 65 my spread would be filled automatically at $2.55, which is a tiny bit more than 1/2 the spread (the extra 5 cents is to cover commissions). The basic idea is to risk $2.5 to make $2.5.  You will also make full profit if the stock moves up only slightly, no huge rally move needed :) 


Note: This is just a trading example for educational purpose only and should not be taken as trading advice. Trading Options carries substantial risk. An ATM credit spread generally risks the full width of the spread minus the credit received. This means that you need to employ your own risk and money management strategies. 


Friday, July 4, 2014

2014/07/04 Muenchner Rueckversicherungs AG - daily Squeeze & Fibonacci Targets

Muenchner Rueckversicherungs AG


Muenchner Rueckversicherungs AG has a lot of push power from Squeezes in the weekly/daily charts. It just broke above the important 163.5 resistance level with more upside potential. 

Fibonacci support and resistance levels:

Target 1 (30min - 161.8%): 165
Target 2 (daily - 100%): 170
Target 3 (daily - 127.2%): 175

Support Clusters(daily): 
Support 1: 159-156.8
Support 2: 151.8 - 150..9
Support 3: 147.6 - 145.8

Wednesday, March 5, 2014

2014/03/05 BIDU in weekly and 4-hour squeeze with Fibinacci targets at 185/190

Baidu - BIDU


Baidu (BIDU) has been coiled in a weekly squeeze for the last seven weeks. Yesterday it also entered into a 4-hour squeeze that might fire today or within the next few days. This four-hour momentum could be used as a trigger for the expected longer-term move from the weekly squeeze. Fibonacci targets are 185 and 190. Additional support comes from seasonality, which indicates that Baidu favors the upside during the months March through October (see T. Bopp at traders-mag)

Friday, October 25, 2013

2013/10/25 QIHU setup - found support at 85 Fibonacci Cluster, now heading for 100


After a corrective move, QIHU has found support at the Fibonacci Cluster around 85. Now it's heading higher with the master trend  aiming for the 127.2% extension target of 100. The TTM_Squeeze has also fired long and its increasing squeeze-momentum (light blue bars) are supporting the idea of further upside potential. It's all setting up nicely for a good Risk/Reward trade.

Extension target 127.2%: 100
Extension target 161.8%: 104
Support cluster (stop):  84 - 85


Thursday, October 24, 2013

Friday, October 18, 2013

2013/10/18 GLD Gold ETF - facing strong upside resistance by Fibonacci Cluster


GLD Gold ETF - although GLD has broken out of a decending wedge yesterday, it is facing strong overhead resistance by a dense Fibonacci Cluster. If the 127.6 - 130.3 cluster zone can be cleared, there is plenty of room to the upside, with the extension targets:

Extension target 127.2%: 141.92
Extension target 161.8%: 147.41


Thursday, October 17, 2013

2013/10/17 EEM Emerging Markets ETF - daily chart with Fibonacci Cluster targets and Elliott wave count


EEM MSCI Emerging Markets ETF - daily chart with Fibonacci Cluster targets and Elliott wave count:
Target Zone 1 (around 127.2% extension):             43.6-44
Target Zone 2 (around 161.8% extension):             44.6-45

Wednesday, October 16, 2013

2013/10/16 DOW Jones Industrial Futures YM - daily chart with Fibonacci Clusters - support and resistance


DOW Futures YM - daily chart with Fibonacci clusters indicating the support and resistance zones:

Support 1:                                15050-14970
Resistance Zone 1:                15250-15270
Risistance Zone 2:                 15410-15460
Extension Target 127,2%:      15926

Monday, November 19, 2012

2012/11/91 EURAUD Elliott Wave VIDEO ANALYSIS and CHART

Today on Nov 19, 2012, the EURAUD currency pair exhibits nice emerging ABC patterns in three different time frames, the 5 min, 4 hour and daily charts. The chart and the purely educational video below show how an entry into the marked would be possible in the lowest time frame (5 min) with a relatively low-risk nearby stop, but with a potential to catch a long run that might lead up to 1.3 or higher in the daily time frame.


Video Analysis: EURAUD


Be aware that trading any kind of financial asset carries the risk of loosing money!

Friday, June 22, 2012

2012/06/21 DOW JONES midterm Elliott Wave VIDEO ANALYSIS and CHART


After yesterday's sell-off, it's time for a fresh Elliott look at the DOW JONES INDUSTRIAL INDEX. As we have run against the mayor resistance level at 12900 in the last days, yesterday's huge drop can be interpreted as the start of a new mid-term Elliott wave. This wave will be the 3rd leg of an ABC formation that started with a dynamic Wave A down during May 2012 and its subsequently corrected in Wave B up until June 20. The recently launched 3rd Elliott Wave C is expected to cover at least 100% of the range of Wave A, i.e. the target area for Wave C will be around 11600. At the current stage (DOW @12600, with our target about 1000 ticks away), this setup provides us with good opportunities to construct mid-term trades with a few weeks holding time and very beneficial risk/reward ratios.


Mid-term:  Wave C will likely develop in 5 sub-waves down to 12400, 12000 and finally 11600.


Video Analysis for the Dow Jones Industrial Index