Monday, July 1, 2013

2013/7/1 REVIEW: DAX weekly options trade of last week (June 24 - 28, 2013)

Review: DAX weekly options trade of last week (June 24 - 28, 2013)
 
Monday, June 24: Entry - bought  weekly DAX 7600 ITM Call @ 163
(using IGMarket weekly options, DAX@7700,  TimeValue = BreakEven = 63) 
Max Risk of Trade: 163      
 
Friday, June 28: Exit - sold 3/5 @368 and later 2/5 @325, Average Sell Price = 220 +30 = 350
Total Profit: 350 - 163 = 187
Risk/Reward: 163 / 187  = 0.87 
 
This week's DAX trade (July 1 -  5, 2013): today on Monday July 1, the DAX has moved erratically all morning and there were no indications for a preferred direction for this week's trade. I will stay on the sideline and when a better situation develops - I will let you know!
 
Please feel free to contact me if you want to learn more about risk-defined option trades.  If you are of the opinion that trading with stop-losses is not quite the smartest approach, then you might be happy to learn some option-tricks that will keep you out of trouble, while increasing your profitability. 

Have a  successful trading week, Tom

Thursday, June 27, 2013

2013/6/27 UPDATE: DAX weekly chart & weekly options trade - Target2 reached

 
DAX weekly options trade: 
Thursday, June 27: Target 2 - TG2@8000 has been reached - nice profits this week :)
The US Markets are still pressing higher, so there's more upside potential. 
Follow it closely (with a trailing stop) or take some risk off the table (e.g. 2nd partial profit of 3)

Wednesday, June 26, 2013

2013/6/26 UPDATE: DAX weekly chart & weekly options trade - Target1 reached


DAX weekly options trade: 
Wednesday, June 24: Target 1 - TG1@7880 has been reached
This is a good level to take some risk off the table and reap partial profits (1/2 or 1/3 of the trade size)


Monday, June 24, 2013

2013/6/24 DAX weekly chart & weekly options trade idea with potential entry / targets


DAX weekly options trade idea: 
Monday, June 24: Entry - bought  a weekly DAX 7600 ITM Call @ 163
(using IGMarket weekly options, DAX@7700,  TimeValue = BreakEven = 63) 
Max Risk of Trade: 163             
Profit Potential(@TG2): 300-63 = 237   
Risk/Reward: risk 100 / make 145 (with directional bias)
Risk Control: maximum risk = premium paid = 163 
(NO stop loss required - weekly options will keep you in the game all week!

Next possible entry point @7750 

Contact me if you want to learn more about such risk-defined option trades
that will keep you from being stopped out by erratic market moves.

Have a  successful trading week, Tom

Monday, June 10, 2013

2013/6/10 DAX weekly - last week's forcasts and weekly option trade in review

  
A quick review on what happened with the DAX and my weekly option trade idea of last week:

Monday, June 3: Entry - bought  a weekly DAX 8400 PUT@100 (DAX@8350, IGMarket weeklies) 
Friday, June 7: Exit - sold the weekly DAX 8400 PUT@275 at Target2 (DAX@8075)
Risk of trade: 100              Profit: 275-100 = 175    
Type of trade: risk 100/lose 100 with directional bias
Risk control: maximum risk = premium paid = 100 (NO stop loss required - you stay in the game!)


Monday, June 3, 2013

Monday, November 19, 2012

2012/11/91 EURAUD Elliott Wave VIDEO ANALYSIS and CHART

Today on Nov 19, 2012, the EURAUD currency pair exhibits nice emerging ABC patterns in three different time frames, the 5 min, 4 hour and daily charts. The chart and the purely educational video below show how an entry into the marked would be possible in the lowest time frame (5 min) with a relatively low-risk nearby stop, but with a potential to catch a long run that might lead up to 1.3 or higher in the daily time frame.


Video Analysis: EURAUD


Be aware that trading any kind of financial asset carries the risk of loosing money!

Wednesday, November 14, 2012

2012/11/13 blog.kimblechartingsolutions.com: Dual test of support for the S&P 500 (SPX, SPY)

In his blog, Chris Kimble identifies a current long-term rising wedge pattern in the S&P 500, which resembles the rising wedges that build up during the periods 1998-2000 and 2006-2007, before large market shifts to the downside occurred. The current wedge is also nearing long-term resistance at 1550 that has held since 2000. In conclusion, this is a time when "risk off" is definitively the safer play!

Chris Kimble blogs: "An important "Dual Test of support" is at hand right now for the 500 index. Long investors best hope it holds, because the support line off the 2009 low is very important!  FYI- Support is Support until broken! Twice over the past 12 years, the 500 index broke support lines of these rising wedges at (1) in the chart below and prices fell off quiet a bit."


Thursday, August 30, 2012

2012/08/27 decisionmoose.com: BUY US Large Caps (SPY) - SELL Long-term Treasury Bonds (BTTRX, TLT)

For Monday August 27, 2012, a new SWITCH SIGNAL (SELL and BUY new) was published as of Friday's close at http://decisionmoose.com/Moosignal.html :

Sell: BTTRX Long-term Treasury Bonds (or ETF alternatives TLT, EDV, ZROZ)
Buy: US Large Cap Stocks (SPY, SPX)

More details about the portfolio and the transaction history at:  http://decisionmoose.com/Moosistory.html

Please note the comments of the signal author at decisionmoose.com/Moosignal.html :

"The model switches from to US Zero-Coupon Long Treasury bonds (BTTRX) to US Large Cap stocks (SPY) on 08/10/2012 @ $140.84. Always familiarize yourself with any investment program and the assets involved before committing to it. Read the FAQs and The Art of the Switch, below, and get a prospectus online from the fund provider.)"

Friday, June 22, 2012

2012/06/21 DOW JONES midterm Elliott Wave VIDEO ANALYSIS and CHART


After yesterday's sell-off, it's time for a fresh Elliott look at the DOW JONES INDUSTRIAL INDEX. As we have run against the mayor resistance level at 12900 in the last days, yesterday's huge drop can be interpreted as the start of a new mid-term Elliott wave. This wave will be the 3rd leg of an ABC formation that started with a dynamic Wave A down during May 2012 and its subsequently corrected in Wave B up until June 20. The recently launched 3rd Elliott Wave C is expected to cover at least 100% of the range of Wave A, i.e. the target area for Wave C will be around 11600. At the current stage (DOW @12600, with our target about 1000 ticks away), this setup provides us with good opportunities to construct mid-term trades with a few weeks holding time and very beneficial risk/reward ratios.


Mid-term:  Wave C will likely develop in 5 sub-waves down to 12400, 12000 and finally 11600.


Video Analysis for the Dow Jones Industrial Index

Thursday, June 14, 2012

2012/06/14 EURUSD midterm Elliott Wave chart

Updated mid-term chart for our earlier EURUSD VIDEO ANALYSIS of 1 June 2012


Mid-term:  corrective Wave 4 has reached the 38.2% retracement level and is likely to head down in Wave 5 to 1.2274 (100%) or 1.2032 (161.8%)
     

Friday, June 8, 2012

2012/06/08 11:00 CET: DOW daytrade idea based on Elliott Waves and Fibonacci

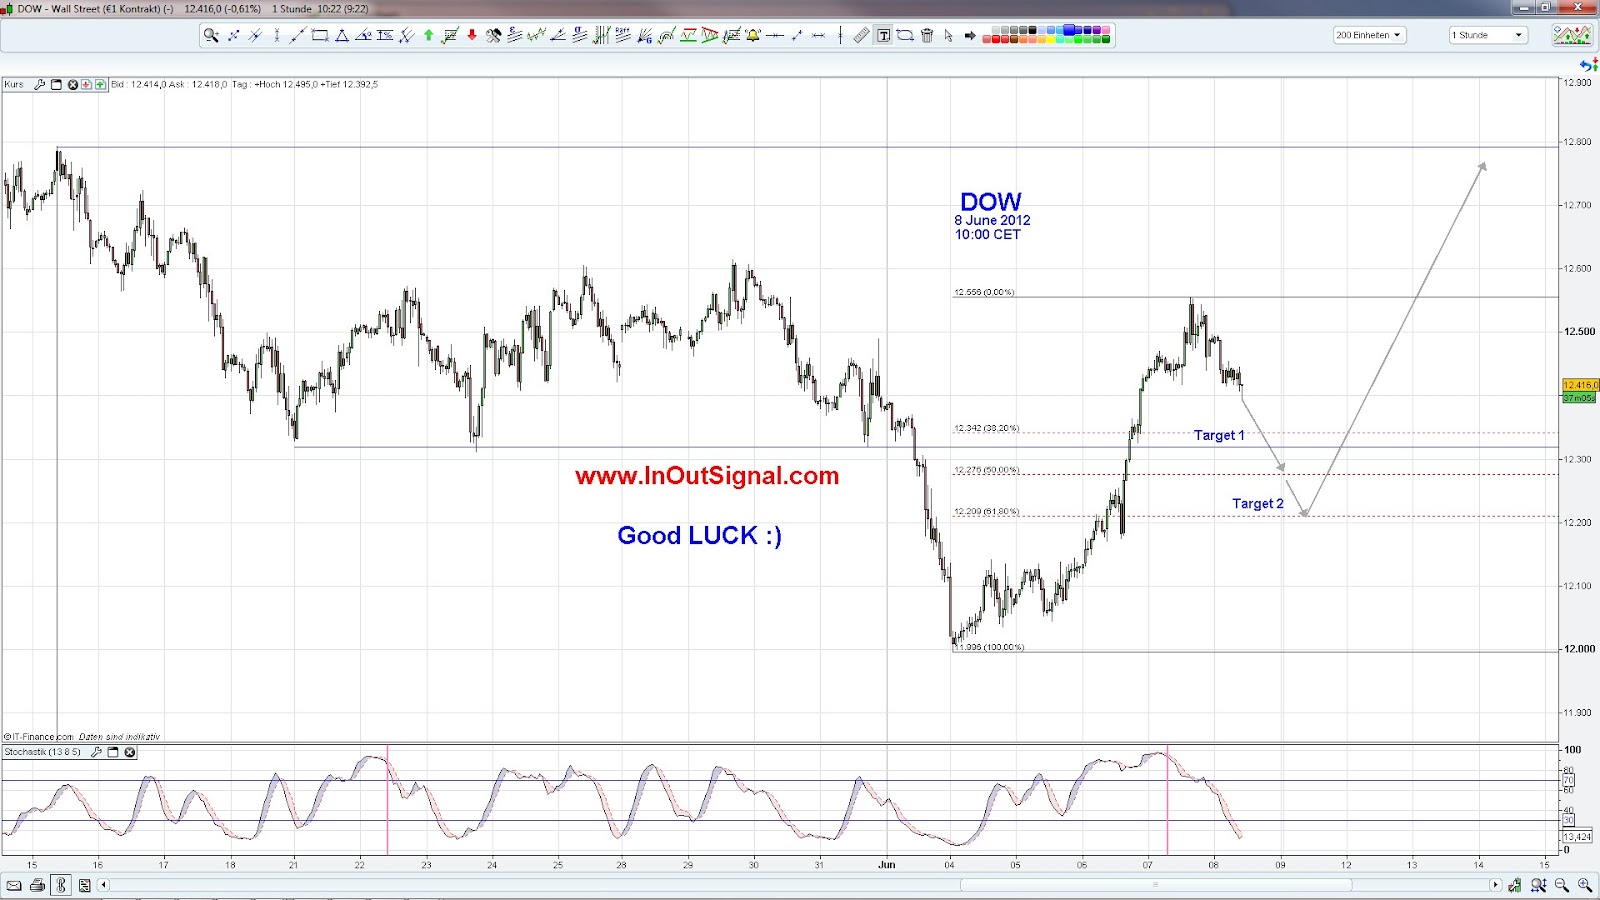
Chances are good that today we will see a bearish retracement of the DOW into the 50-61% area (12300 - 12200) or or even lower. The upwards trend since June 4 has already been broken this morning, at around 10:00 CET. For Elliott Wave and Fibonacci fans there is also a video for more details on the analysis.